


 Art & Design
 Auto & Vehicles
 Beauty
 Business
 Education
 Entertainment
 Finance
 Food & Drink
 Health & Fitness
 House & Home
 Libraries & Demo
 Maps & Navigation
 Medical
 Music & Audio
 Parenting
 Personalization
 Photography
 Productivity
 Shopping
 Social
 Sports
 Tools
Tools Travel & Local
 Video Players
 Weather
 Family


 Graphical Analysis GW (Go Wire
OS :
Version :VARY
Size :
Updated :Jun 11,2018
Developer :Vernier Software & Technology
 Ask AI
 Ask AI
Pros and Cons from users' feedback
Based on the user reviews of the Vermeer Graphical Analysis app, here are three pros and three cons, each within a 15-word limit:
Pros:
1. Accurate and reliable data collection, praised by many users for its precision.
2. User-friendly interface allows for easy graphing and analysis, even for beginners.
3. Helpful support team responds promptly to questions and issues, users appreciate.
Cons:
1. Limited compatibility with certain devices and operating systems, frustrating some users.
2. Frequent crashes and occasional freezing issues mar the overall experience, many report.
3. Steep learning curve for advanced features, leaving some users feeling overwhelmed.
Please note that these summaries are based on a general analysis of the user reviews and may not reflect your individual experiences with the app.
App
Downloads
<
>


App
Survey
-
Application interactivity Does it affect the experience?
-
Do you think the stability of the application affects the experience?
-
Where do you get the new APP
-
Application technology innovation Does it affect the experience?
Description
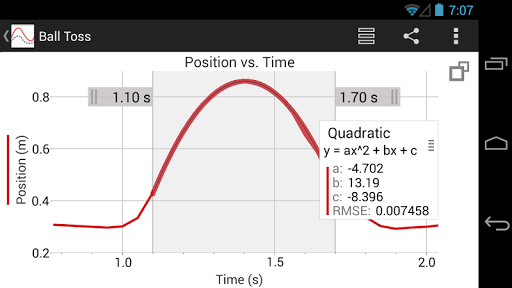
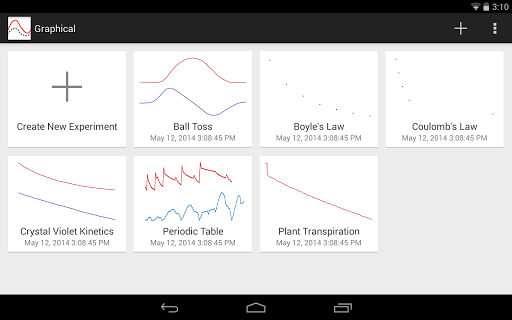
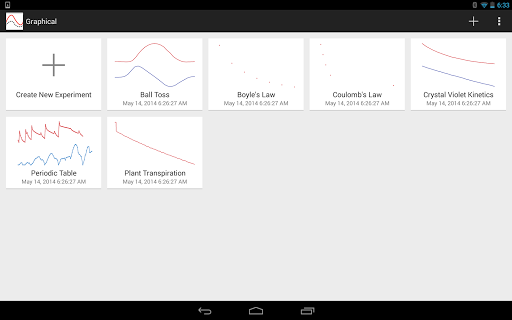
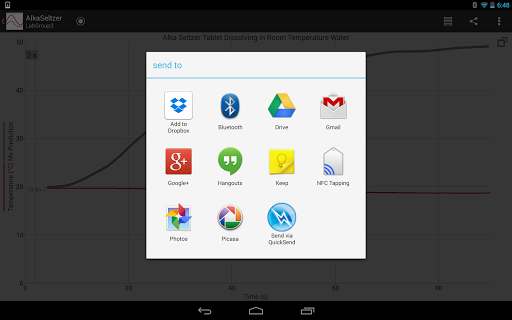
Graphical Analysis™ GW is a tool for science students to collect, graph, and analyze data from Vernier Go Wireless® sensors.
Sensor data-collection support:
• Vernier Go Wireless® Temp and Go Wireless pH sensors
• Vernier Go Wireless Heart Rate and Go Wireless Exercise Heart Rate monitors
• Vernier LabQuest® sensors used with Go Wireless Link or LabQuest Stream interfaces
Additional experiment options:
• Data Sharing via Wi-Fi connection to LabQuest 2 or Logger Pro® 3
• Built-in Sensors (accelerometers)
• Manual Entry
Note: Sensor data collection and Data Sharing require the purchase of hardware from Vernier Software & Technology. Built-in sensor and manual entry of data can be performed without a hardware purchase. For more information on Data Sharing, visit http://www.vernier.com/css
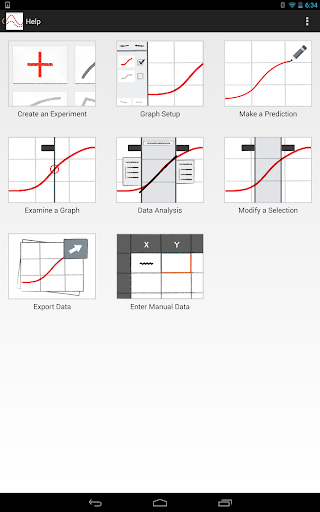
Key Features - Data Collection
• Multi-sensor data-collection support (requires LabQuest Stream)
• Time Based, Event Based data-collection modes
• Configurable data-collection rate and duration for time-based data collection
• Option to zero sensor readings
• Manual entry of data from keyboard and clipboard
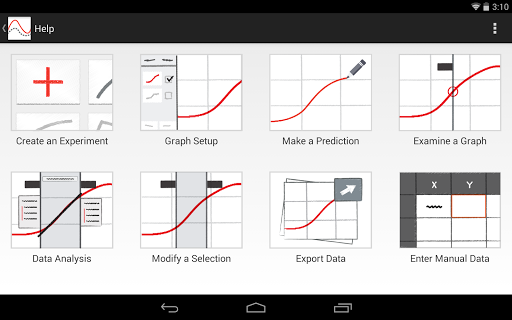
Key Features - Data Analysis
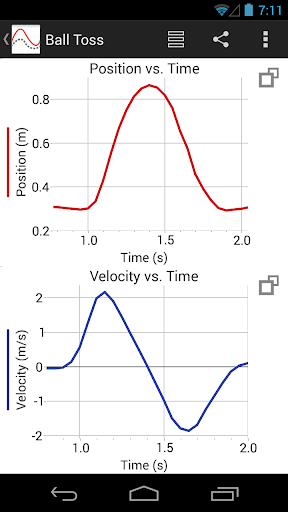
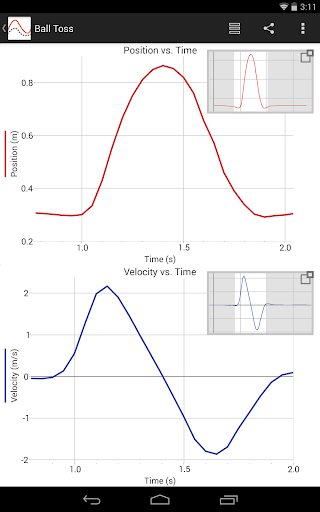
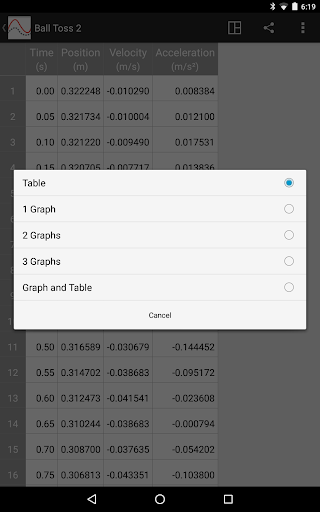
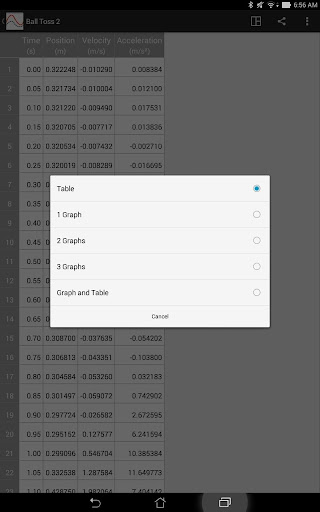
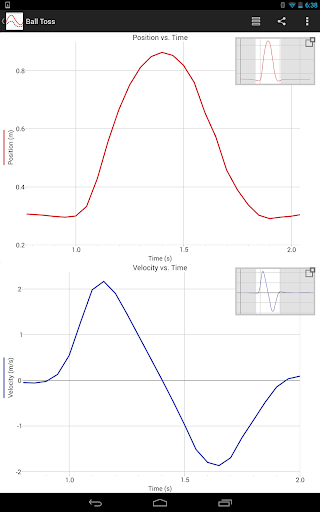
• Display one, two, or three graphs simultaneously
• View data in a table or show a graph and table side-by-side
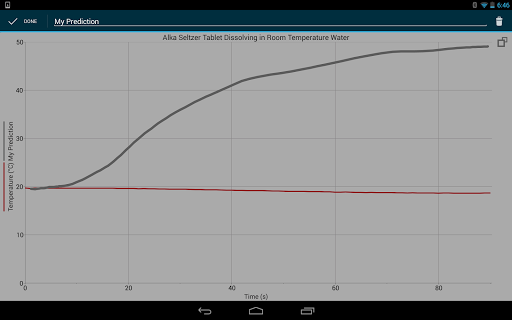
• Draw Predictions on a graph to uncover misconceptions
• Examine and select data
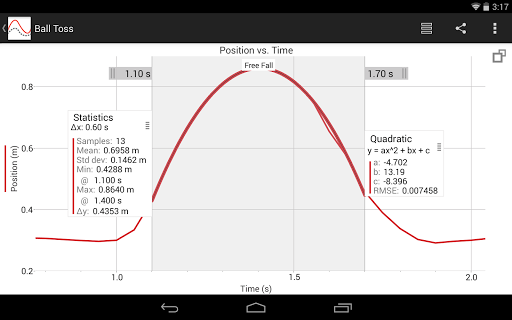
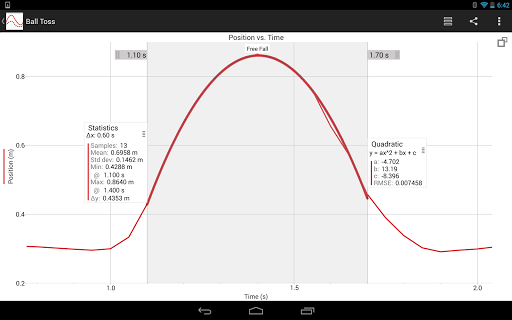
• Apply Statistics calculations to find mean, min, max, and standard deviation
• Perform curve fits, including linear, quadratic, natural exponent, and more
• Pinch to scale graphs
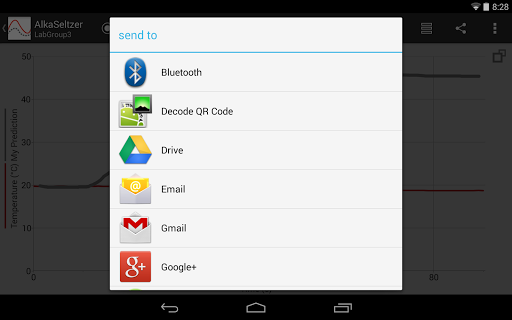
Key Features - Collaboration and Sharing
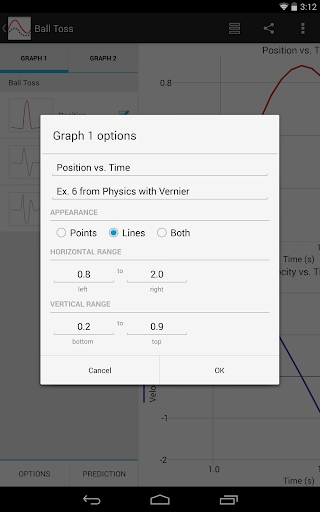
• Create text annotations and add graph titles
• Export graphs and data for printing and inclusion in lab reports
• Export data in .CSV format for analysis of data in spreadsheet software such as Excel®, Google Sheets™, and Numbers®
Note: The above features apply to version 3.2 only, available for devices running Android OS version 4.3 or newer. Android devices running OS versions 4.1-4.22 will receive Graphical Analysis version 1.2, which only supports Data Sharing, Built-in Sensors, and Manual Entry experiments.
Vernier Software & Technology has over 35 years of experience in providing effective learning resources for understanding experimental data in science and math classrooms. Graphical Analysis GW is a part of the extensive system of sensors, interfaces, and data-collection software from Vernier for science and STEM education.
Sensor data-collection support:
• Vernier Go Wireless® Temp and Go Wireless pH sensors
• Vernier Go Wireless Heart Rate and Go Wireless Exercise Heart Rate monitors
• Vernier LabQuest® sensors used with Go Wireless Link or LabQuest Stream interfaces
Additional experiment options:
• Data Sharing via Wi-Fi connection to LabQuest 2 or Logger Pro® 3
• Built-in Sensors (accelerometers)
• Manual Entry
Note: Sensor data collection and Data Sharing require the purchase of hardware from Vernier Software & Technology. Built-in sensor and manual entry of data can be performed without a hardware purchase. For more information on Data Sharing, visit http://www.vernier.com/css
Key Features - Data Collection
• Multi-sensor data-collection support (requires LabQuest Stream)
• Time Based, Event Based data-collection modes
• Configurable data-collection rate and duration for time-based data collection
• Option to zero sensor readings
• Manual entry of data from keyboard and clipboard
Key Features - Data Analysis
• Display one, two, or three graphs simultaneously
• View data in a table or show a graph and table side-by-side
• Draw Predictions on a graph to uncover misconceptions
• Examine and select data
• Apply Statistics calculations to find mean, min, max, and standard deviation
• Perform curve fits, including linear, quadratic, natural exponent, and more
• Pinch to scale graphs
Key Features - Collaboration and Sharing
• Create text annotations and add graph titles
• Export graphs and data for printing and inclusion in lab reports
• Export data in .CSV format for analysis of data in spreadsheet software such as Excel®, Google Sheets™, and Numbers®
Note: The above features apply to version 3.2 only, available for devices running Android OS version 4.3 or newer. Android devices running OS versions 4.1-4.22 will receive Graphical Analysis version 1.2, which only supports Data Sharing, Built-in Sensors, and Manual Entry experiments.
Vernier Software & Technology has over 35 years of experience in providing effective learning resources for understanding experimental data in science and math classrooms. Graphical Analysis GW is a part of the extensive system of sensors, interfaces, and data-collection software from Vernier for science and STEM education.
{{descriptionMoreText}}
Comments (0)
{{commentText.length}}/{{maxCommentText}}
{{commentError}}{{commentUserError}}
-
{{comment.commentUser.substring(0, 1)}}By {{comment.commentUser}}{{comment.commentDateString}}
Developer apps
- Google Play
- App Store


Category Top
apps
- Google Play
- App Store
4
5
Lifestyle
 Daily Diary:Journal with Lock
 Life360: Find Family & Friends
 Pinterest
 T-Mobile Tuesdays
 Frecuencia
Photography
 Picsart AI Photo Editor, Video
 Amazon Photos
 Time Warp Scan - Face Scanner
 ToonApp: Cartoon Photo Editor
 Pixelup - AI Photo Enhancer


More Apps