


 Art & Design
 Auto & Vehicles
 Beauty
 Business
 Education
 Entertainment
 Finance
 Food & Drink
 Health & Fitness
 House & Home
 Libraries & Demo
 Maps & Navigation
 Medical
 Music & Audio
 Parenting
 Personalization
 Photography
 Productivity
 Shopping
 Social
 Sports
 Tools
Tools Travel & Local
 Video Players
 Weather
 Family


 Graphical Analysis
OS :
Version :5.15.2
Size :
Updated :Dec 13,2022
Developer :Vernier Software & Technology
 Ask AI
You can ask
the AI some questions about the app
Here are three potential topics that users may discuss about the Graphical Analysis app, turned into questions:
1. What features do you think are most useful for data analysis in the Graphical Analysis app?
2. How do you plan to use the app's graphing and analysis tools in your scientific or educational work?
3. Are you looking forward to any specific updates or new features in future versions of the Graphical Analysis app?
 Ask AI
Pros and Cons from users' feedback
I'd be happy to help you with that! After analyzing the user reviews on the Google Play Store, here are three pros and three cons of the app:
Pros:
1. "Accurate data analysis and graphing capabilities make it a valuable tool for science students."
2. "User-friendly interface and intuitive design make it easy to use for beginners."
3. "Real-time data logging and graphing features are extremely useful for data collection and analysis."
Cons:
1. "Limited compatibility with certain devices and operating systems can be frustrating."
2. "Some users report issues with data export and sharing, which can be inconvenient."
3. "Lack of advanced features and customization options may disappoint power users."
Please note that these are general summaries based on the user reviews and may not reflect your personal experience with the app
App
Downloads
<
>


App
Survey
-
What is your Mobile System?
-
What is the number of APPs on your phone?
-
Do you think the payment of application features affects the experience?
-
Does the update frequency of the application affect the experience?
Description
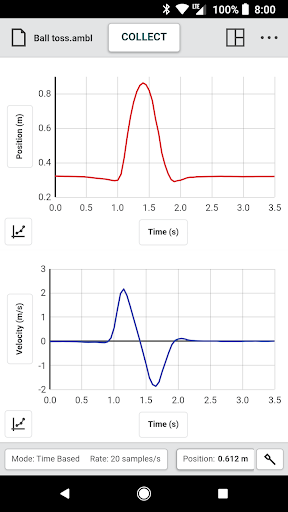
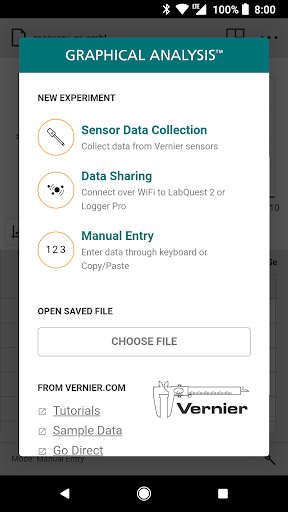
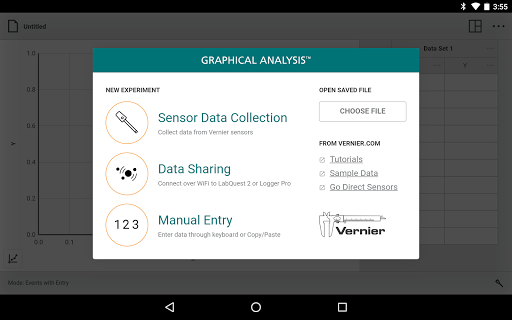
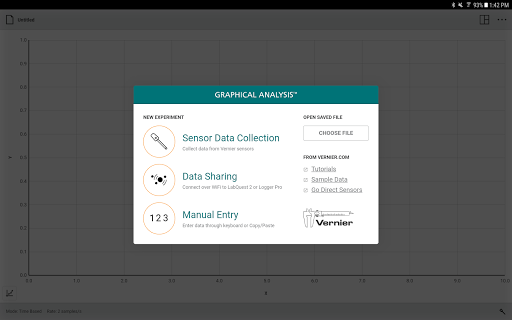
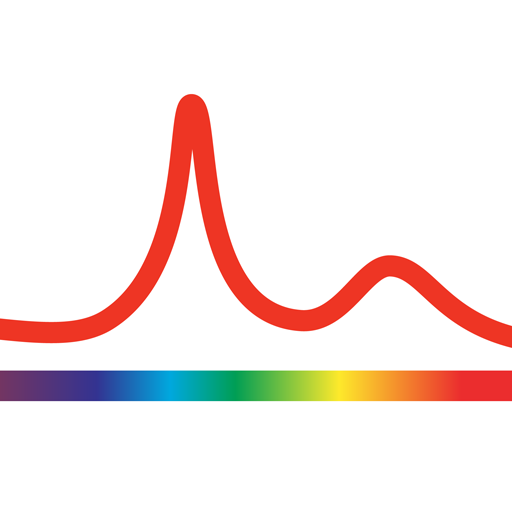
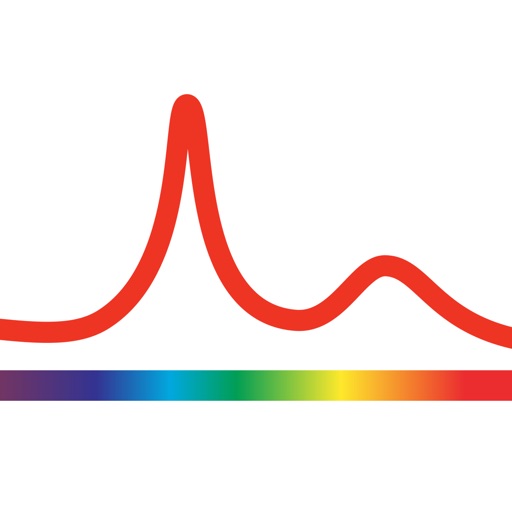
Graphical Analysis™ is a tool for science students to collect, graph, and analyze data from Vernier sensors.
Sensor data-collection support:
• Vernier Go Direct® sensors - with Bluetooth® wireless technology
• Vernier Go Wireless® Heart Rate and Go Wireless Exercise Heart Rate monitors
Additional experiment options:
• Data Sharing via Wi-Fi connection to LabQuest 2, LabQuest 3 or Logger Pro® 3
• Manual Entry
Note: Sensor data collection and Data Sharing require the purchase of hardware from Vernier Software & Technology. Manual entry of data can be performed without a hardware purchase. For more information on Data Sharing, visit http://www.vernier.com/css
Key Features - Data Collection
• Multi-sensor data-collection support
• Time Based, Event Based, and Drop Counting data-collection modes
• Configurable data-collection rate and duration for time-based data collection
• Optional triggering of time-based data collection based on sensor value
• Customizable unit display on supported sensors
• Sensor calibrations
• Option to zero and reverse sensor readings
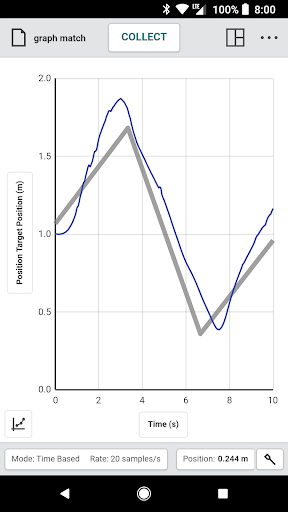
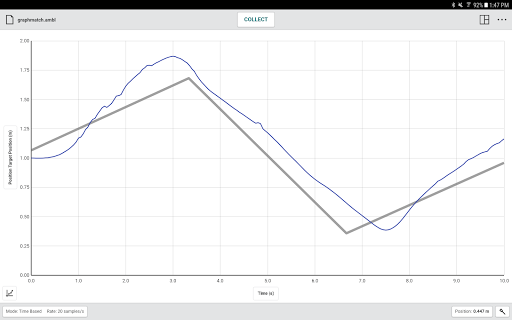
• Graph match feature for use with motion detectors
• Manual entry of data from keyboard and clipboard
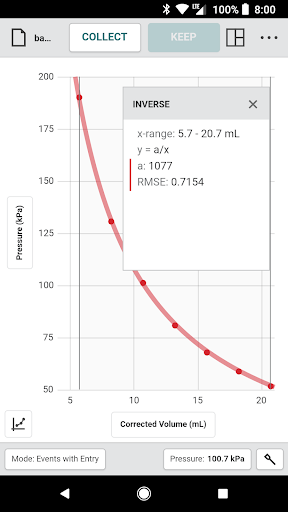
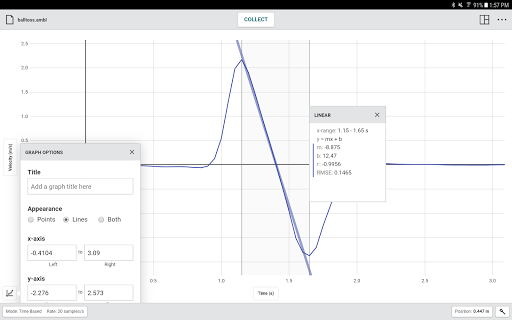
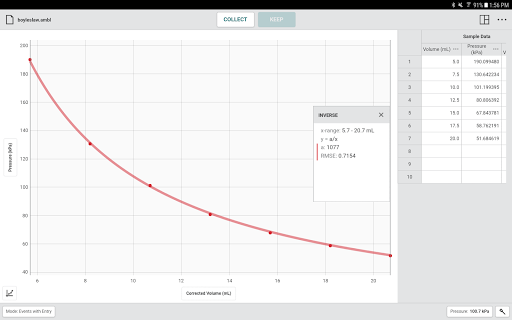
Key Features - Data Analysis
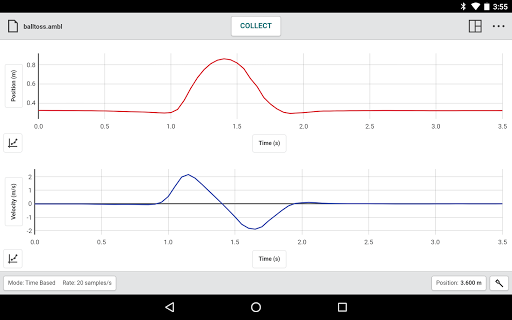
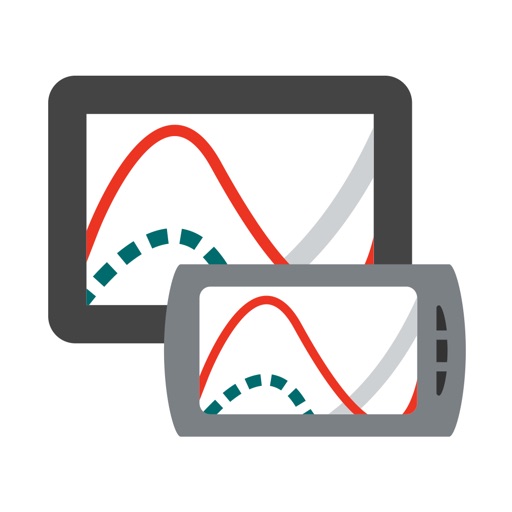
• Display one, two, or three graphs simultaneously
• View data in a table or show a graph and table side-by-side
• Draw Predictions on a graph to uncover misconceptions
• Examine, interpolate/extrapolate, and select data
• Use Tangent tool to show instantaneous rates of change of the data
• Find area under a curve using the Integral tool
• Apply Statistics calculations to find mean, min, max, and standard deviation
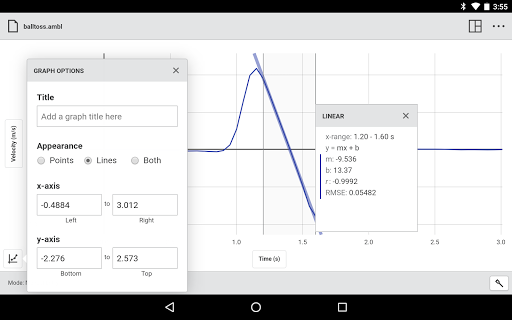
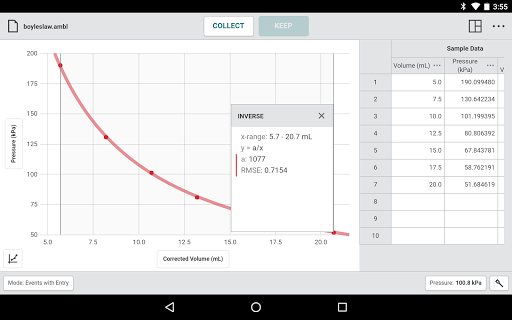
• Perform curve fits, including linear, quadratic, natural exponent, and more
• Add calculated columns based on existing data to linearize data or investigate related concepts
Key Features - Collaboration and Sharing
• Create text annotations and add graph titles
• Export graphs and data for printing and inclusion in lab reports
• Save files (.ambl file format) to the Cloud for exchange with Graphical Analysis on other Android™ devices, Chromebooks™, Windows® and macOS® computers, and iOS devices
• Export data in .CSV format for analysis of data in spreadsheet software such as Excel, Google Sheets, and Numbers
• Adjust font sizes for easier viewing when presenting to your class
Vernier Software & Technology has over 35 years of experience in providing effective learning resources for understanding experimental data in science and math classrooms. Graphical Analysis is a part of the extensive system of sensors, interfaces, and data-collection software from Vernier for science and STEM education.
Sensor data-collection support:
• Vernier Go Direct® sensors - with Bluetooth® wireless technology
• Vernier Go Wireless® Heart Rate and Go Wireless Exercise Heart Rate monitors
Additional experiment options:
• Data Sharing via Wi-Fi connection to LabQuest 2, LabQuest 3 or Logger Pro® 3
• Manual Entry
Note: Sensor data collection and Data Sharing require the purchase of hardware from Vernier Software & Technology. Manual entry of data can be performed without a hardware purchase. For more information on Data Sharing, visit http://www.vernier.com/css
Key Features - Data Collection
• Multi-sensor data-collection support
• Time Based, Event Based, and Drop Counting data-collection modes
• Configurable data-collection rate and duration for time-based data collection
• Optional triggering of time-based data collection based on sensor value
• Customizable unit display on supported sensors
• Sensor calibrations
• Option to zero and reverse sensor readings
• Graph match feature for use with motion detectors
• Manual entry of data from keyboard and clipboard
Key Features - Data Analysis
• Display one, two, or three graphs simultaneously
• View data in a table or show a graph and table side-by-side
• Draw Predictions on a graph to uncover misconceptions
• Examine, interpolate/extrapolate, and select data
• Use Tangent tool to show instantaneous rates of change of the data
• Find area under a curve using the Integral tool
• Apply Statistics calculations to find mean, min, max, and standard deviation
• Perform curve fits, including linear, quadratic, natural exponent, and more
• Add calculated columns based on existing data to linearize data or investigate related concepts
Key Features - Collaboration and Sharing
• Create text annotations and add graph titles
• Export graphs and data for printing and inclusion in lab reports
• Save files (.ambl file format) to the Cloud for exchange with Graphical Analysis on other Android™ devices, Chromebooks™, Windows® and macOS® computers, and iOS devices
• Export data in .CSV format for analysis of data in spreadsheet software such as Excel, Google Sheets, and Numbers
• Adjust font sizes for easier viewing when presenting to your class
Vernier Software & Technology has over 35 years of experience in providing effective learning resources for understanding experimental data in science and math classrooms. Graphical Analysis is a part of the extensive system of sensors, interfaces, and data-collection software from Vernier for science and STEM education.
{{descriptionMoreText}}
Comments (5)
{{commentText.length}}/{{maxCommentText}}
{{commentError}}{{commentUserError}}
-
{{comment.commentUser.substring(0, 1)}}By {{comment.commentUser}}{{comment.commentDateString}}
-
SBy Samuel HoweAug 9,2022
-
DBy Daniel AdeJun 15,2022
-
SBy Sam DunnageMay 24,2022
-
JBy JimmywellsApr 25,2022
-
KBy Keith VogelsangMar 25,2022
Developer apps
- Google Play
- App Store


Category Top
apps
- Google Play
- App Store
4
5
Lifestyle
 Daily Diary:Journal with Lock
 Life360: Find Family & Friends
 Pinterest
 T-Mobile Tuesdays
 Frecuencia
Photography
 Picsart AI Photo Editor, Video
 Amazon Photos
 Time Warp Scan - Face Scanner
 ToonApp: Cartoon Photo Editor
 Pixelup - AI Photo Enhancer


More Apps